


Capacity matching design of lithium battery - positive and negative electrodes
Aug,07,24
Novices in the industry are generally confused about the application of N/P design examples for traditional graphite negative
lithium-ion batteries and the N/P ratio for lithium titanate negative lithium-ion batteries mentioned in the article.
This article focuses on these two issues. Of course, due to limitations in level, there are areas where the description is insufficient. Please give me more guidance.
Text: It is very important to correctly calculate the reasonable ratio coefficient of positive and negative electrode capacity when designing lithium batteries.
For traditional graphite negative lithium-ion batteries,
the short board of battery charge and discharge cycle failure mainly lies in lithium deposition and dead zone on the negative electrode side,
so the solution of excessive negative electrode is usually adopted.
In this case, the capacity of the battery is limited by the positive electrode capacity,
and the negative electrode capacity/positive electrode capacity ratio is greater than 1.0 (i.e. N/P ratio>1.0).
If there is an excess of positive electrode, during charging, the excess lithium ions from the positive electrode cannot enter
the negative electrode, resulting in lithium deposition on the surface of the negative electrode and the formation of dendrites,
which deteriorates the cycling performance of the battery and can also cause internal short circuits, leading to battery safety issues.
Therefore, in general graphite negative electrode lithium batteries, the negative electrode is slightly more than the positive electrode,
but it cannot be too much, as too much excess will consume the lithium in the positive electrode;
In addition, it can also cause negative electrode waste, reduce battery energy density, and increase battery costs.
For lithium titanate negative electrode batteries, due to the stable structure of LTO negative electrode,
high voltage platform, excellent cycling performance and no lithium deposition phenomenon,
the main cause of cycling failure is at the positive terminal.
The recommended solution for battery system design is to use excessive positive electrode and negative electrode capacity limitation (N/P ratio<1.0),
which can alleviate electrolyte decomposition caused by high positive electrode potential in high potential areas when the battery is close to or in a fully charged state.
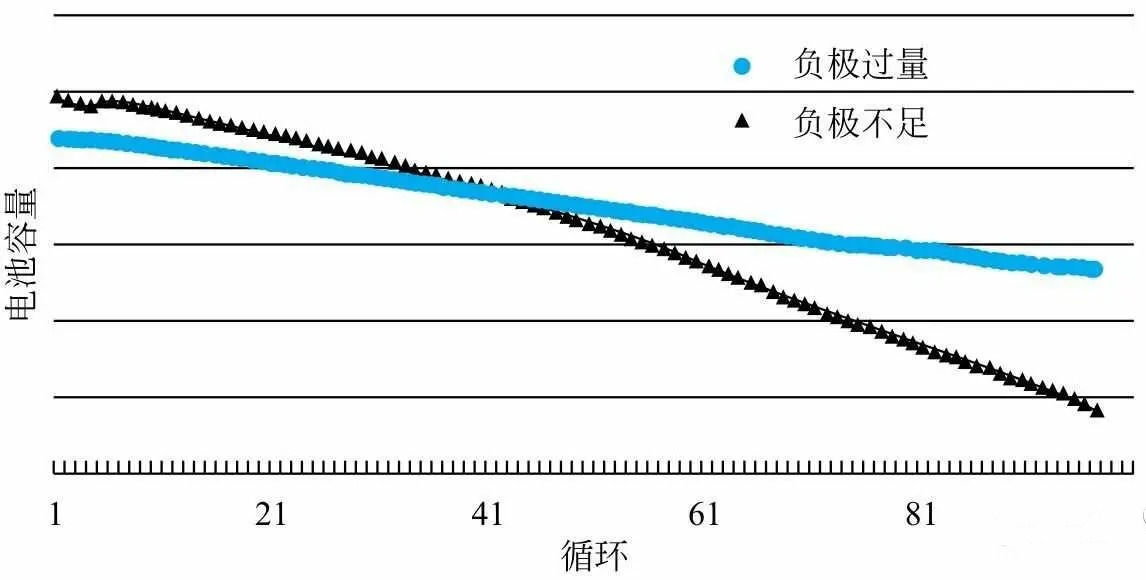
Figure 1: Performance Trend of Batteries with Insufficient and Excessive Graphite Negative Electrodes
Calculation example of N/P ratio for traditional graphite negative lithium-ion batteries
The N/P ratio (Negative/Positive) refers to the ratio of negative electrode capacity to positive electrode capacity, and there is also another term called CB (cell balance).
In general, the ratio of positive and negative electrodes in a battery is mainly determined by the following factors:
① The initial efficiency of positive and negative electrode materials should consider all reactive substances,
including conductive agents, adhesives, current collectors, separators, and electrolytes.
② Coating accuracy of equipment: The ideal coating accuracy now can reach 100%. If the coating accuracy is poor, it should be considered.
③ The decay rate of positive and negative electrode cycles:
If the positive electrode decays quickly, the N/P ratio is lower than the design, allowing the positive electrode to be in a shallow charge discharge state.
Conversely, if the negative electrode decays quickly, the N/P ratio is higher, allowing the negative electrode to be in a shallow charge discharge state
④ The rate performance that the battery needs to achieve.
The calculation formula for N/P:
N/P=negative electrode surface density x active material ratio x active material discharge specific capacity/positive
electrode surface density x active material ratio x active material discharge specific capacity
For example, LiCoO2 has a first round charge discharge efficiency of about 95% at a voltage range of 4.2-3.0V and 25 ℃,
while the first round charge discharge efficiency of ternary materials is between 86% and 90%.
Table 1 shows the mass specific capacity of commercial NCM111 during the first three charge discharge cycles of 1C discharge.
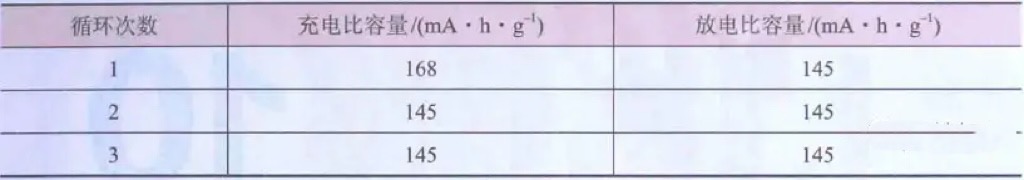
Table 1 Specific Capacity of Commercial NCM111 Battery in the First Three Charge Discharge Cycles
Before using material ratios, calculations can be made based on the first round efficiency data provided by the material manufacturer.
If the manufacturer does not provide it, it is best to test the first round efficiency of the material using a button type half cell first,
in order to calculate the positive and negative electrode ratio.
The positive and negative electrode ratio of lithium batteries with graphite negative electrodes can be calculated according to the empirical formula N/P=1.08,
where N and P are the mass specific capacities of the negative and positive active materials, respectively.
The calculation formulas are shown in equations (1) and (2).
Excess negative electrode is beneficial in preventing lithium deposition on the negative electrode surface caused by overcharging of the battery,
which is beneficial for improving the cycle life and safety of the battery.
N=negative electrode surface density x active material ratio x active material discharge specific capacity (1)
P=positive electrode surface density x active material ratio x active material discharge specific capacity (2)
Assuming a positive electrode density of 200mg · cm-2,
an active material ratio of 90%, and a discharge specific capacity of 145mA · h · g-1, then P=200mg · cm-2 × 0.9 × 145 mA · h · g-1=26.1 mA · h · cm-2.
Assuming a negative electrode active material ratio of 95% and a discharge specific capacity of 320mA · h · g-1,
a surface density design of 93 mg · cm-2 is more suitable for the negative electrode.
At this point, N=93mg · cm-2 × 0.95 × 320 mA · h · g-1=28.3mA · h · cm-2, and N/P=1.084.
Because the irreversible capacity of battery materials in the first round can also affect the ratio of positive and negative electrodes,
the charging capacity of the first round should also be used to verify the above calculation.
According to Table 2, the first cycle charging and discharging efficiency of LiCoO2 is 95%,
NCM111 is 86%, and the first cycle charging and discharging efficiency of the negative electrode is 90%.
Their charging capacities are 153mA · h · g-1, 169mA · h · g-1, and 355mA · h · g-1, respectively.
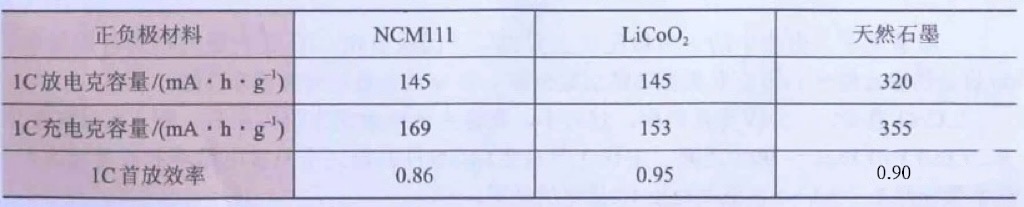
Table 2 Initial discharge capacity and efficiency of positive and negative electrode materials (typical values)
PLCO=27.54mA·h·cm–2
N=31.36 mA·h·cm–2
N/PLCO=1.138
P111=30.42mA·h·cm–2
N/P111=1.03
Generally speaking, the N/P ratio calculated based on charging capacity should be greater than 1.03.
If it is lower than 1.03, the positive and negative pole ratios need to be fine tuned again.
For example, when the first round efficiency of the positive electrode is 80%
and the charging capacity of the positive electrode is 181 mA · h · g-1, then P=32.58 mA · h · cm-2, N/P=0.96,
it is necessary to adjust the surface density of the positive and negative electrodes to make N/P greater than 1, preferably around 1.03.
For mixed positive electrode materials, the calculation should also be carried out according to the above method.
The influence of different N/P ratios on the performance of lithium titanate negative electrode lithium batteries
The influence of different N/P ratios on the performance of battery capacity
This study used ternary NCM as the positive electrode material and lithium titanate LTO as the negative electrode material to fabricate flexible packaging lithium-ion batteries;
The experimental scheme adopts a fixed positive electrode capacity and a variable negative electrode capacity,
setting the positive electrode capacity to 100 and designing negative electrode capacities of 87, 96, 99, and 102, respectively, as shown in Figure 2.
When the N/P ratio is less than 1.0, the negative electrode capacity is insufficient, the positive electrode capacity is excessive relative to the negative electrode capacity,
and the battery capacity is limited by the negative electrode capacity;
As the negative electrode capacity increases, i.e. the N/P ratio increases, the battery capacity also increases;
When N/P is higher than 1.0, the positive electrode capacity is insufficient compared to the negative electrode capacity, and the battery capacity is limited by the positive electrode capacity.
Even if the negative electrode capacity is further increased, the battery capacity will remain unchanged.
It can be seen that under this experimental scheme, as the N/P ratio increases, the battery capacity also increases.
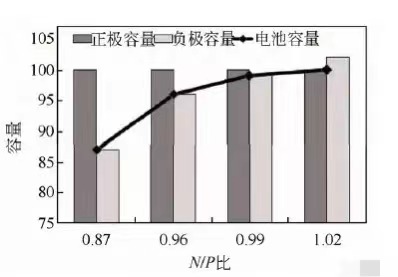
Figure 2: Schematic diagram of the relationship between four N/P ratios, positive and negative electrode capacity, and battery capacity
The full battery capacity test also verified the above analysis, as shown in Figure 3 (a).
With the increase of N/P ratio,
the full battery capacity increased from 2430 mA · h to 2793 mA · h. By calculating the gram capacity of positive and negative electrode materials,
the trend of gram capacity changing with N/P ratio was obtained, as shown in Figure 3 (b).
It can be seen that increasing the N/P ratio can improve the gram capacity of positive electrode materials and battery capacity.
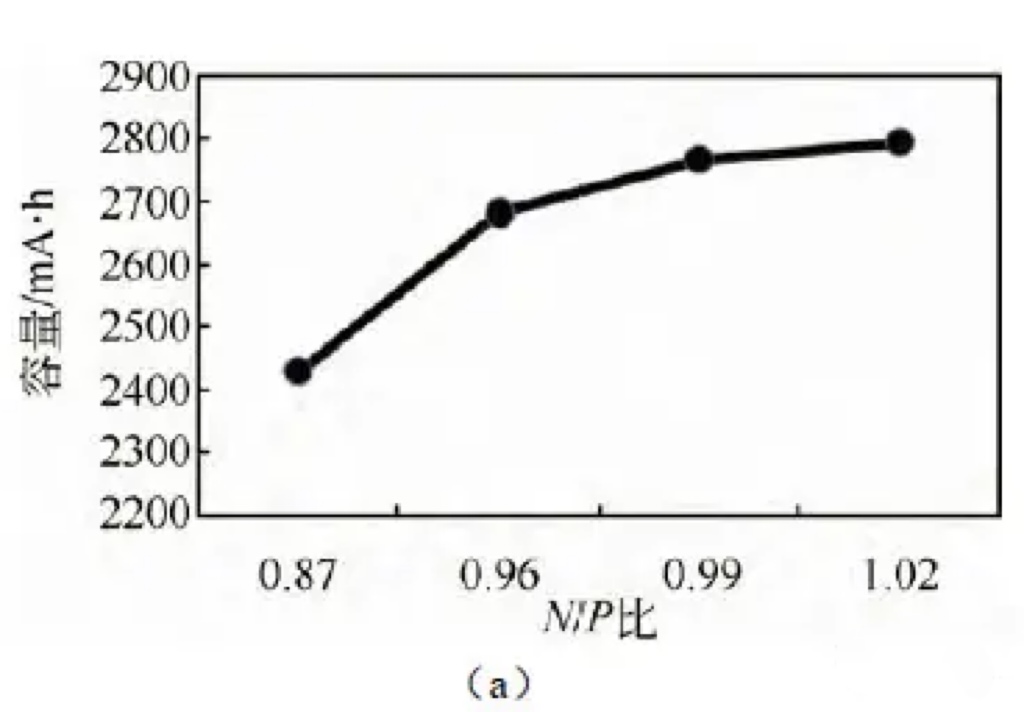
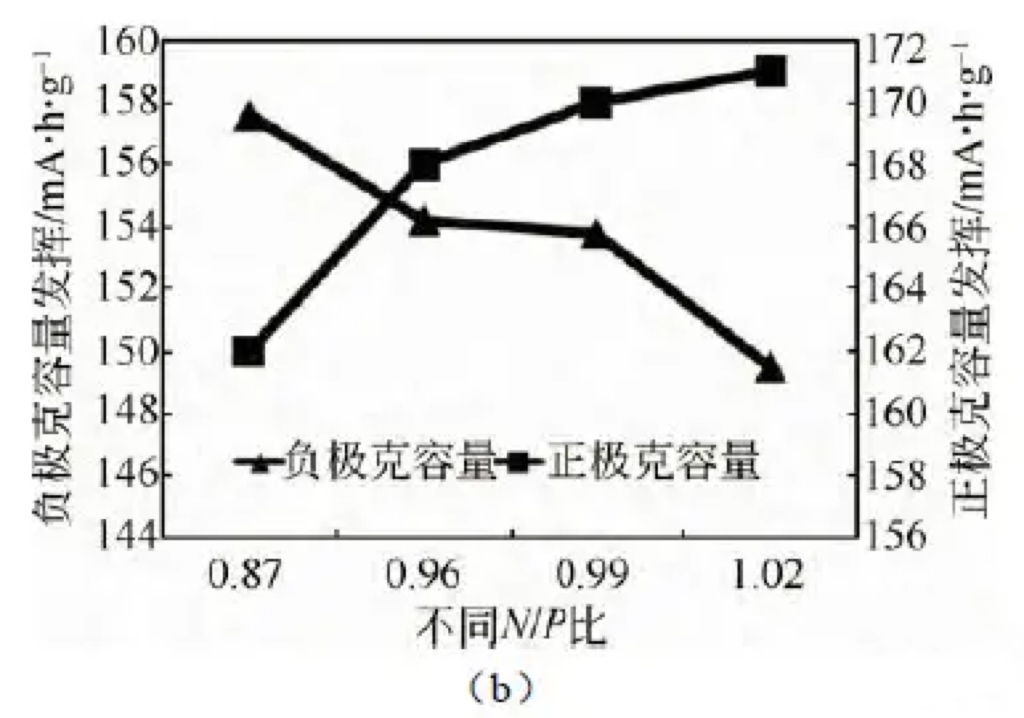
Figure 3 (a) Effects of different N/P ratios on battery capacity (b) Effects of different N/P ratios on positive and negative electrode capacity
The influence of different N/P ratios on the high-temperature storage performance of batteries
The high temperature storage (60 ℃, 100% SOC) test is conducted by charging from 1.0C to 2.8V/0.1C,
letting it sit for 5 minutes, then releasing from 1.0C to 1.5V, and cycling for 3 times to select the highest capacity as the initial capacity;
Subsequently, the battery cell is charged from 1.0C to 2.8V/0.1C, and the full charge voltage, internal resistance, and full charge thickness before storage are tested and recorded;
After storing the battery cells at 60 ℃ for 7 days, the full charge voltage, internal resistance, and full charge thickness of the corresponding battery cells were measured.
Then, the battery cells were discharged from 1.0C to 1.5V as residual capacity, charged from 1.0C to 2.8V/0.1C, and left for 5 minutes.
After 3 cycles, the discharge capacity was recorded as recovery capacity. The test results are shown in Figure 3 (a).
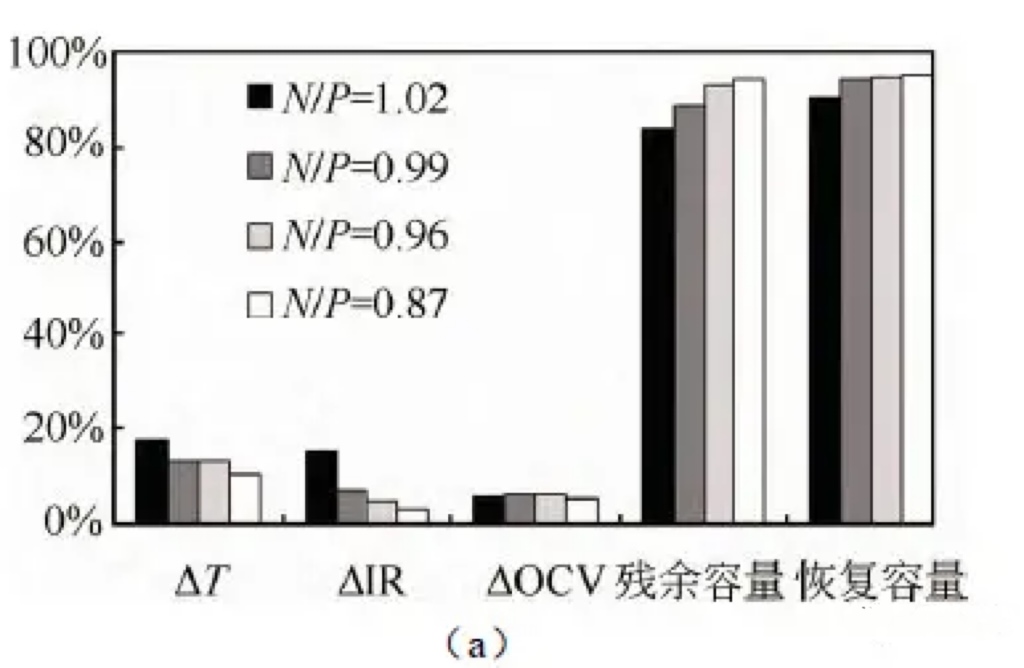
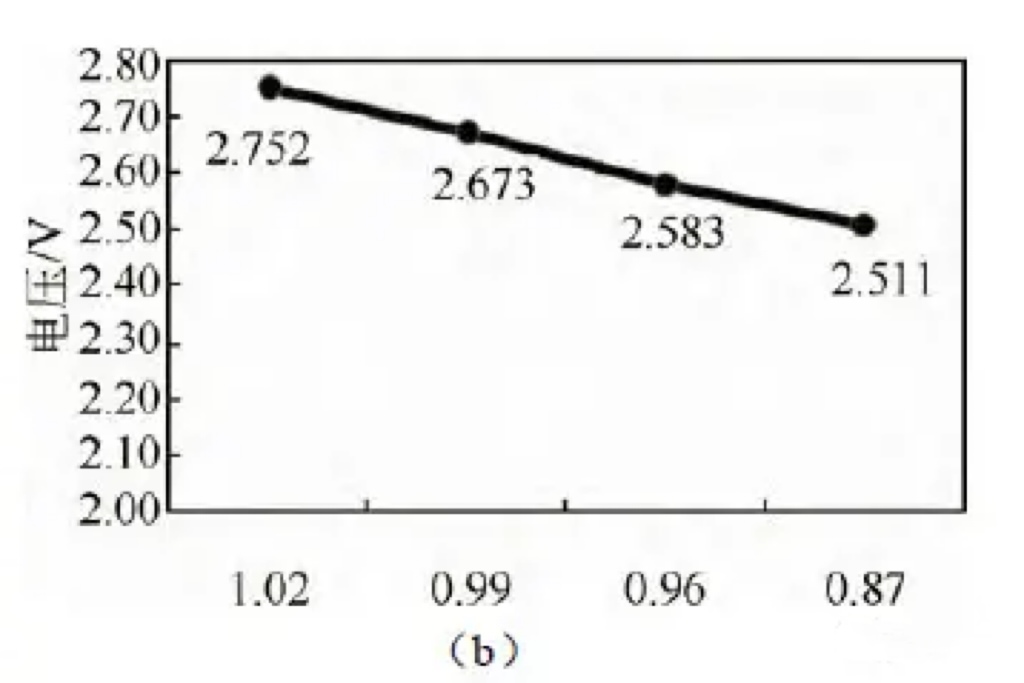
Figure 4 (a) Effects of different N/P ratios on battery thickness, internal resistance, voltage, and residual capacity recovery after storage at 60 ℃;
(b) Battery voltage with different N/P ratios before storage at 60 ℃
For a battery with an N/P ratio of 0.87, the thickness expansion rate is the smallest at 13.4% after being stored at 60 ℃ for 14 days at full charge.
The battery with an N/P ratio of 1.02 has the highest thickness expansion rate at 17.5%.
As the N/P ratio decreases, the thickness expansion of the battery during high-temperature storage gradually decreases;
Similarly, batteries with lower N/P ratios have lower internal resistance growth, reaching 0.03 m Ω,
while batteries with higher N/P ratios have higher internal resistance growth, reaching 0.15 m Ω.
The residual and recovery capacities gradually increase as N/P decreases.
According to the pre storage voltage test, as shown in Figure 3 (b), as the N/P ratio decreases, the voltage gradually decreases.
When the N/P ratio is 0.87, the battery voltage is 2.411V.
The low battery terminal voltage can reduce the internal side reactions of the battery during high-temperature storage,
which is beneficial for improving residual and recovery capacity.
It can be seen that reducing the N/P ratio is beneficial for improving the high-temperature storage performance of batteries.
The influence of different N/P ratios on battery cycling performance
Three different N/P ratios (0.87/0.99/1.02) NCM/LTO system batteries were subjected to 3C charging and 3C discharging cycle tests, with a voltage range of 2.8-1.5 V. The cycling capacity retention rates under the three N/P ratios are shown in Figure 5 (a). From the graph, it can be seen that the battery with an N/P ratio of 0.87 has the best cycling performance, with a capacity retention rate of 97% after 1600 cycles. When the N/P ratio increases to 0.96 and 1.02, the cycling capacity retention rate significantly deteriorates. The rate of change in internal resistance during the cycling process is shown in Figure 5 (b). The cycle with an N/P ratio of 0.87 has the smallest rate of increase in internal resistance, with an increase of 7.6% after 1800 cycles. When the N/P ratio increases to 1.02, the internal resistance sharply increases to 34% after 1800 cycles. It can be seen that the N/P ratio design of batteries has a significant impact on cycling performance, and a low N/P ratio is more conducive to battery cycling performance.
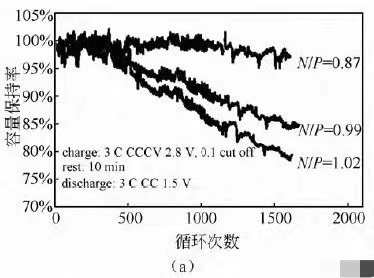
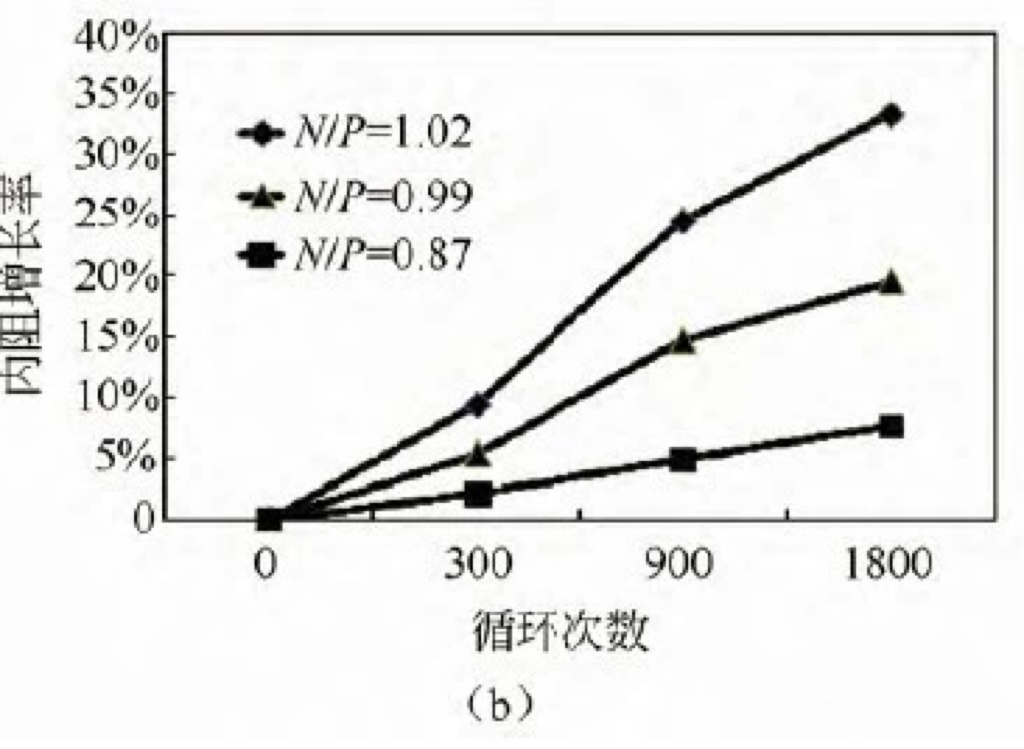
Figure 5 Comparison of different N/P ratio cycle capacity retention rate (a) and cycle internal resistance growth rate (b)
Three electrode testing with different N/P ratios
Three electrode tests were conducted on batteries with different N/P ratios under the following conditions:
3C constant current charging to 2.8V, 0.1C cut-off, 30 minute sleep, and 3C discharge to 1.5V. The test results are shown in Figure 6.
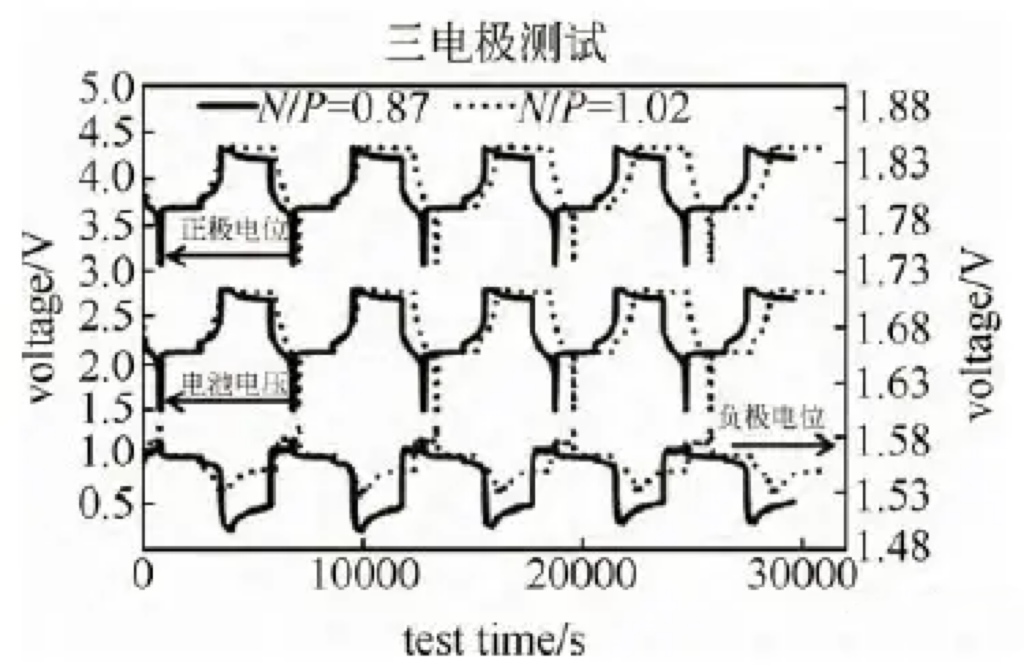
Figure 6 Monitoring of Positive and Negative Potential of Two N/P Ratio Batteries
The positive electrode potential of the battery with an N/P ratio of 0.87 decreased from 4.325 V in the initial stage of constant voltage charging to 4.295 V in the final stage of constant voltage charging,
and continued to decrease to 4.215 V during the subsequent 30 minute sleep period.
The positive electrode potential with an N/P ratio of 1.00 remained basically unchanged at 4.335 V during constant voltage charging, and decreased to 4.321 V during the 30 minute sleep period.
The negative electrode potential with an N/P ratio of 0.87 decreased from 1.56 V to 1.50 V, while the negative electrode potential with an N/P ratio of 1.00 remained relatively constant,
only decreasing from 1.56 V to 1.54 V. The N/P ratio is 0.87, and the battery voltage decreases from 2.8V to 2.69V during the 30 minute sleep period.
The N/P ratio is 1.00, and the battery voltage remains basically unchanged, only decreasing from 2.8V to 2.77V.
It can be seen that the positive electrode potential with low N/P has a greater voltage drop during the constant voltage charging stage and the subsequent sleep process.
The positive electrode potential with N/P of 0.87 is significantly lower than that with N/P of 1.0.
From the three electrode test, it can be seen that for the LTO negative electrode, the voltage plateau is around 1.55V,
and the vast majority of electrolyte solvents have stable electrochemical performance on the lithium titanate negative electrode side.
However, the positive electrode side has a higher potential,
and the electrolyte is prone to oxidation reactions on the positive electrode side, especially when approaching a fully charged state.
Therefore, for battery systems with an N/P ratio less than 1 (LTO capacity limit), when the battery is fully charged,
the negative electrode potential will decrease from 1.56V to 1.50V, and the positive electrode potential will decrease from 4.325V to 4.295V during constant voltage charging,
and continue to decrease to 4.215V during the subsequent 30 minute sleep depolarization process;
For battery systems with an N/P ratio greater than 1 (positive electrode capacity limit), there is an excess of LTO relative to the positive electrode. During the charging process,
the potential of LTO remains basically unchanged at around 1.55V, only decreasing from 1.56V to 1.54V.
However, the positive electrode potential remains basically unchanged at 4.335V during constant voltage charging,
which is higher than the positive electrode potential of 4.295V in low N/P ratio batteries.
The higher positive electrode voltage state makes it easier for oxidation and other side reactions to occur between the electrolyte and the positive electrode,
resulting in poor cycling performance and high-temperature storage performance.
conclusion
For lithium titanate negative lithium-ion batteries, increasing the N/P ratio is beneficial for the positive electrode capacity to be fully utilized
and for improving the initial discharge capacity of the battery;
However, increasing the N/P ratio will increase the potential of the positive electrode,
and the electrolyte is prone to oxidation reactions on the positive electrode side, especially when approaching full charge.
A low N/P ratio can ensure that the positive electrode has a low electrode potential,
thereby reducing the internal secondary reactions of the battery during high-temperature storage and cycling,
which is beneficial for improving the high-temperature storage and cycling performance of the battery.
When the energy density requirement is not high, in order to ensure long-life cycling and good high-temperature performance,
the N/P ratio can be appropriately reduced to between 0.85 and 0.9.


